



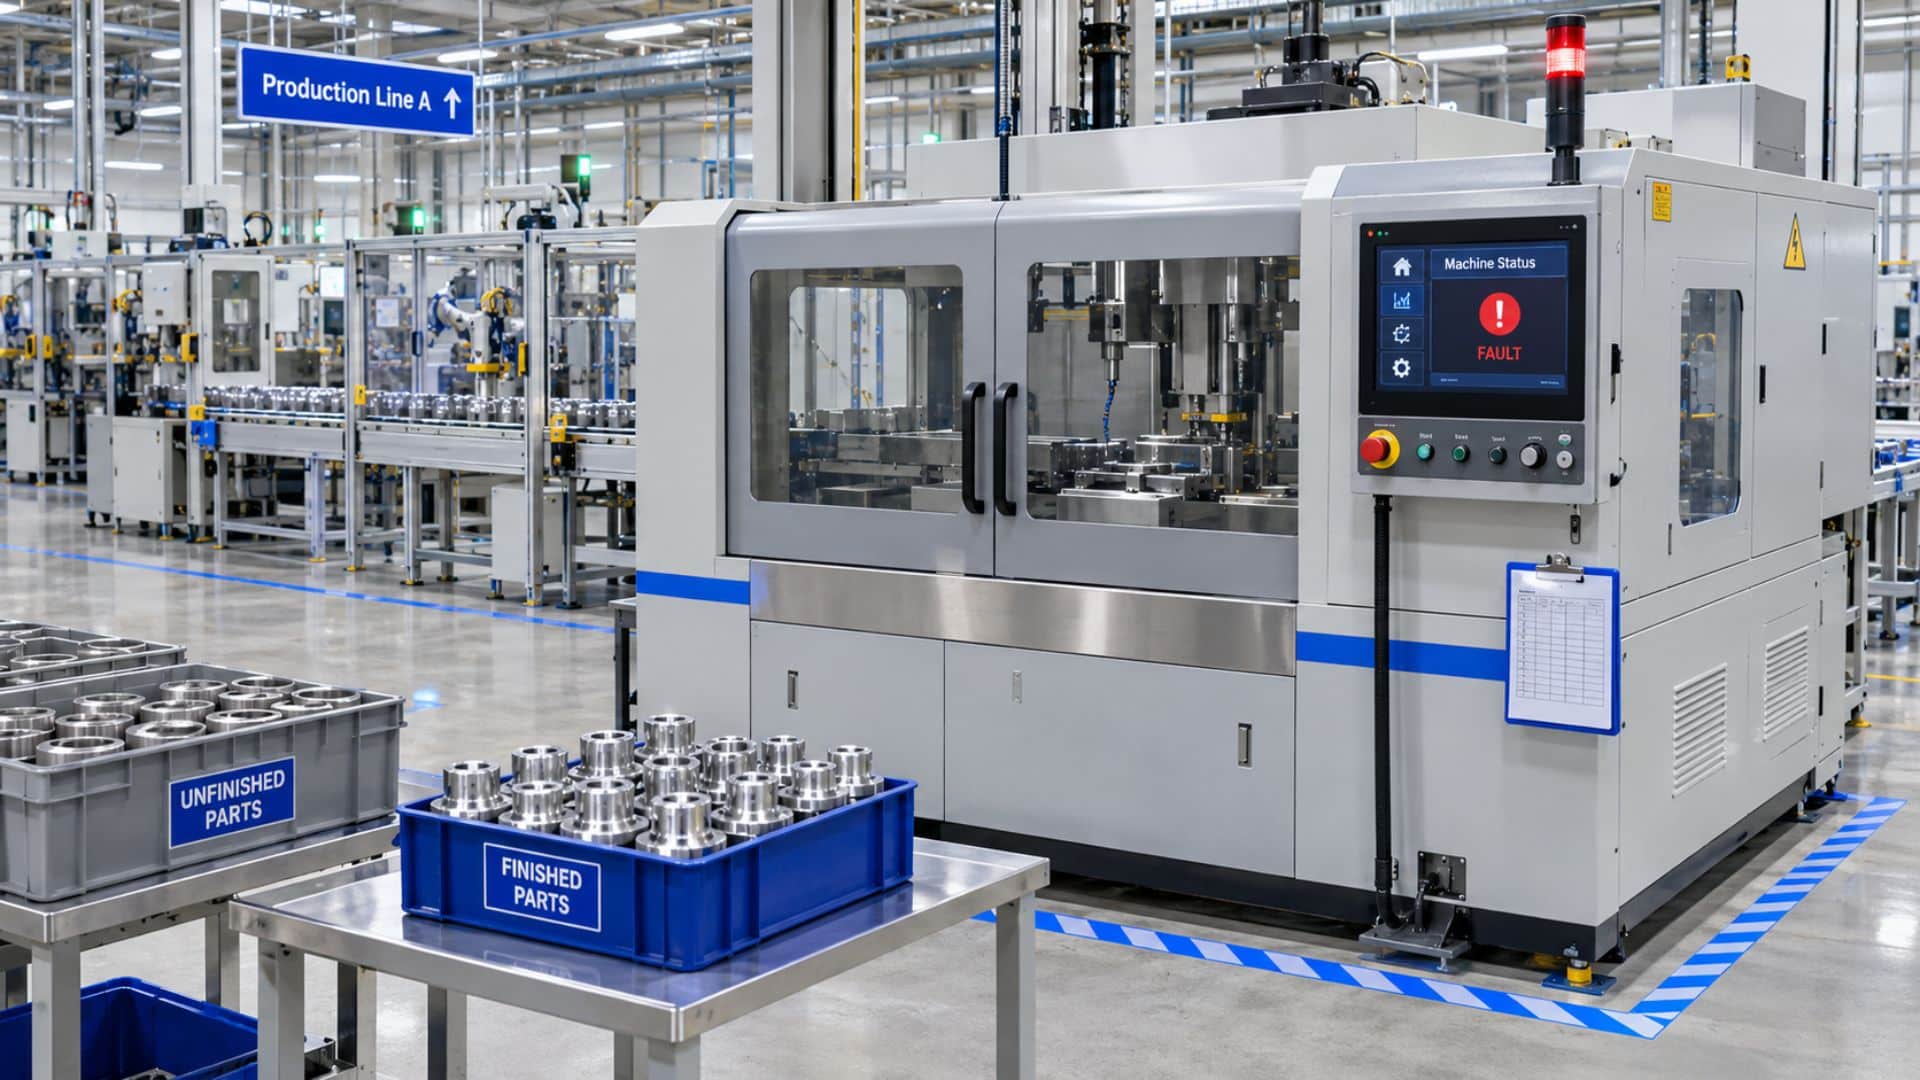
A machine throws Fault Code 47. The downtime system maps it to “Mechanical.” The line restarts, the stop is filed under a reason, and any root cause analysis manufacturing teams run later starts from that label.
Nobody knows why the machine stopped. Downtime reason codes label an event, and a label can’t carry a cause.
Plenty has been written about building better code lists: shorter menus, plant-floor wording, options tuned to each machine. Those guides cover that work well. A well-built list still can’t tell you why a machine stopped, or when the connection feeding it has gone quiet.
Root Cause Analysis in Manufacturing Starts With Context
A fault code is a trigger. It is the signal a machine raises when a reading crosses a limit or a sensor fails to confirm a position. It records what the machine detected and when. A cause is the reason that condition existed, and that reason usually sits outside the machine’s own signal.
Return to Fault Code 47. The press did stop, so the code is accurate. Yet several different situations could produce it: a material batch running slightly off spec, a warm stretch on the floor, an upstream station delivering parts late, or an operator adjustment made earlier in the shift. The code looks identical in every case.
Root cause work depends on what else was true at that moment. When that surrounding record doesn’t exist, the analysis falls back on the code. Teams then argue over theories in a meeting, because nothing in the data can settle the question.
| A fault code records | Root cause analysis also needs |
|---|---|
| The machine stopped | What the upstream process was doing |
| The time of the stop | Environmental conditions on the floor at that time |
| The code the controller raised | Any operator action before the stop |
| How long the stop lasted | The material batch in use |
Where the Five Whys Run Out of Evidence
The five whys is a common technique: ask why a problem happened, then ask why again until you reach a cause you can fix. Fishbone diagrams and failure mode reviews work the same way, by organizing the questions a team should ask. Each answer still needs evidence behind it.
Without a record of conditions at the time of the stop, every answer comes from memory. Memory differs from shift to shift, and the person who watched the stop is often not the person who reads the report, so each “why” gets a different answer depending on who is asked.
Why Mapping Fault Codes to Downtime Reasons Feels Finished
One-to-one mapping is fast. Someone builds a table that sends each fault code to a downtime reason, the report fills itself in, and every stop has an entry. That satisfies the reporting requirement, so the effort tends to end there.
Plants often build this table in their manufacturing execution system (MES). If you are still choosing an MES system, ask how it handles context beyond the code.
The cost shows up later. A ranking of downtime by reason shows Mechanical as the biggest loss, so maintenance fixes what it can find. Then the same code returns on another shift. Everyone agrees it happened again, but nobody can say why it happened either time, because the record holds the same label twice and nothing around it.
A Code 47 on first shift and a Code 47 on third shift look like one problem. They may be two different problems that happen to share a label, and the mapping has no way to tell them apart.
The mapping also limits what the data can teach you. A table that groups many codes into a handful of categories loses detail each time it groups them. The detail it drops is often the part that separates one failure from another. More reports built on those categories add volume without adding explanation.
The Data Pipeline Is Part of the Data
Downtime logging depends on a chain. The machine raises a signal, a controller passes it along, a connection carries it to software, and the software records the stop. One common connection is OPC UA, a widely used standard that lets machines and controllers share data with other systems. When any link in the chain drops, downtime logging drops with it.
Connections drop for ordinary reasons: a network change, a restarted controller, an expired certificate, a software update. Each one is routine, and each can leave logging silent while the machines keep producing parts.
How a Gap Hides as a Good Shift
A stop that happens during an outage never reaches the log. The report for that period shows no downtime, which looks exactly like a shift where everything ran. Nothing in the report separates a quiet shift from a silent connection.
Where a Downtime Record Can Break
(link down)
Many teams watch the machine values flowing through the connection. Fewer watch the connection itself. The first sign of trouble can be a person noticing that a line’s numbers look too good, or a monthly review turning up a hole in the data. By then the missing stops can’t be recovered, and any root cause analysis for that period rests on incomplete evidence. A zero in a downtime report only means something when you know the source was reporting.
“A zero in a downtime report only means something when you know the source was reporting.”
Questions Worth Asking About Your Data Source
Four checks show how much you can trust a quiet period:
- Does your system tell “no downtime” apart from “no data”?
- Who gets an alert when a machine or data source goes silent?
- Can you see, for any shift, how complete the data was?
- How soon would you learn that a connection had been down for a full day?
If the answers are unclear, the reports built on that data deserve a second look before anyone uses them to assign a cause.
What Root-Cause-Ready Downtime Data Looks Like
Root-cause-ready downtime data is continuous, sits alongside the conditions on the floor when each stop happened, and reports on its own health so a gap announces itself.
What Context Adds to a Single Stop
Suppose the log shows Code 47 alongside a steady rise in temperature around that machine, and a pattern of idling in the period before the stop. Now the team has a lead to test: whether heat or an intermittent feed causes the fault. When Code 47 returns on another shift, they can check whether the same conditions were present. Several stops that share the same conditions are evidence of a cause.
Where Thinaer Fits
Thinaer is the Physical AI capture layer. It captures what is happening in the physical environment, including machine on, off and idle status, utilization, environmental conditions, and location and movement, and delivers it as structured, AI-ready data. That record gives root cause work something to compare a stop against.
The data goes to the systems you already run. Thinaer delivers it through Sonar, MQTT and REST APIs. Your MES, analytics tools and AI models can all work from the same record, on any cloud and with any model. Your MES keeps its role, and your engineers keep the analysis. Thinaer supplies the surrounding evidence.
The same standard applies to the data’s own health. Thinaer works from the idea that data you can’t see the health of is data you can’t fully trust. A quiet stretch in the record should always have an explanation.
Where to Start This Week
You can test your own data without buying anything. Three checks will show where the gaps are:
- Pick one stop that keeps recurring and try to explain it using only what your systems recorded. If you can’t, you have found the gap.
- Scan the last month for stretches with no events at all, and confirm the data source was reporting during them.
- List what else you would need to see at the moment of a stop before you could name a cause.
What to Do With What You Find
Start with visibility into the data source, since every later step depends on trusting it. Next, add the surrounding conditions for your most frequent stops, beginning with the machines that cost the most production time. Pick one line to start with, so the team can see what the added context changes before rolling it out further. That keeps the first comparison simple: the same stops, with and without the surrounding record. Then revisit the code mapping. Richer data will show which categories are hiding distinct failures, and any root cause analysis manufacturing teams run afterward starts from better evidence.
For maintenance programs, Predictive Maintenance Is Not Enough explains why real-time operational visibility is the missing link. To see what live visibility looks like in practice, read Real-Time Ops Dashboards.
The models are here. The data isn’t. We fix that.