



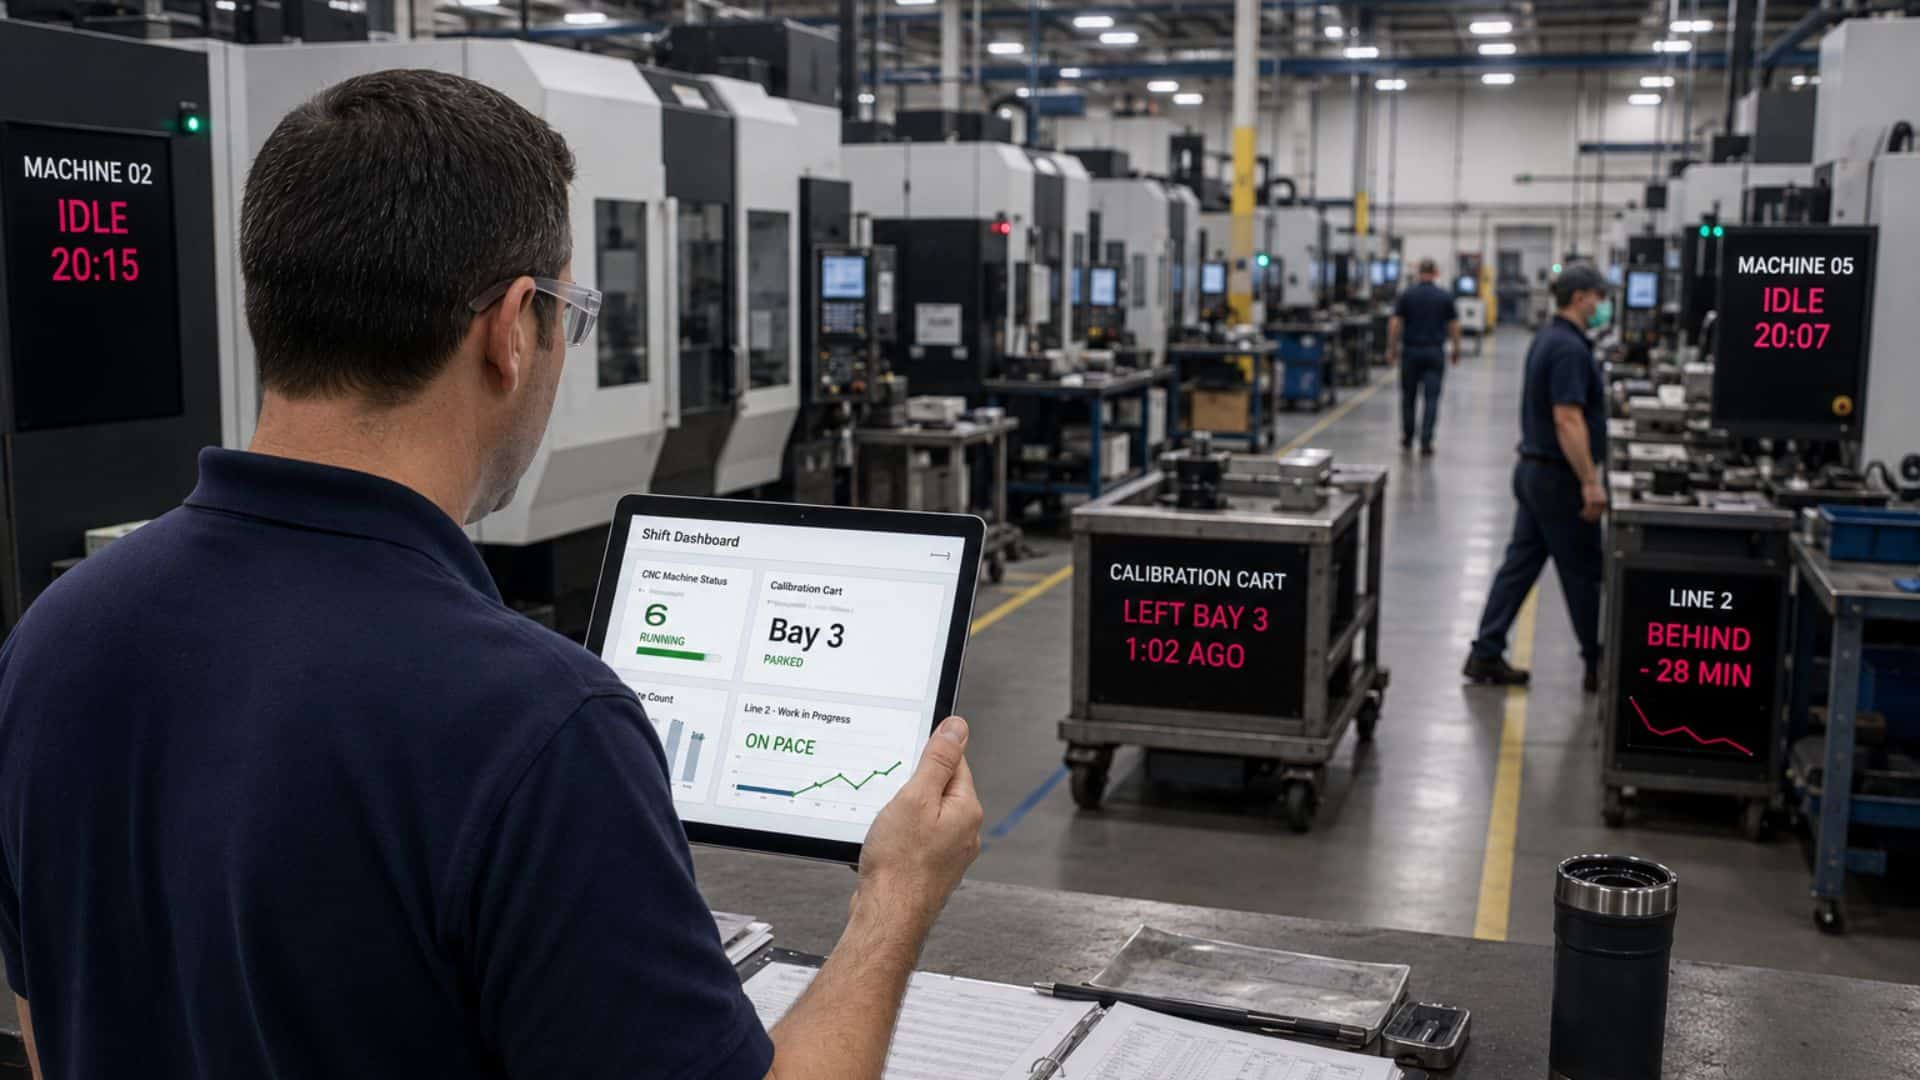
A plant manager pulls up the shift dashboard. According to the screen, six CNC machines are running, the calibration cart is parked in bay 3, and work-in-progress on line 2 is on pace. None of that matches what’s actually happening on the floor right now — two of those six machines have been idle for twenty minutes, the calibration cart left bay 3 an hour ago, and line 2 fell behind before lunch.
That gap is the everyday reality behind most manufacturing visibility claims: the dashboard looks confident, and the dashboard is wrong. Most tools sold as “visibility” solutions actually show yesterday’s data dressed up as today’s. Some manufacturers call this shop floor visibility instead — the label changes, but the underlying problem doesn’t. Either way, it isn’t a dashboard problem. It’s a data problem. You can’t visualize what you never captured. Solving it starts one layer beneath the dashboard, at the point where activity on the floor either becomes data or doesn’t.
Why Manufacturing Visibility Keeps Falling Short
The Checkpoint Problem
Manufacturing visibility usually breaks down long before it reaches a screen. Most plants build their picture of the floor from shift-change spreadsheets, barcode scans, and manual entries into the MES (Manufacturing Execution System) — and every one of those is a checkpoint, not a continuous stream. A checkpoint tells you where something was the last time a person stopped to record it. It doesn’t tell you where that thing is now.
Take a tool crib. On paper, a torque wrench checked out at 6 a.m. is still with the technician who signed for it. In practice, it changed hands twice, sat unused in a different bay for two hours, and has been missing since second shift started. Nobody logs a tool’s location between check-out and check-in, so the system has no way to know any of that. Multiply that gap across WIP tracking, machine utilization, and environmental monitoring, and the dashboard becomes a record of what was true at the last checkpoint — not what’s true now.
Signs of a Checkpoint Illusion
A few signs your manufacturing visibility is a checkpoint illusion rather than the real thing:
- The dashboard reflects the last scan or shift-change entry, not the current shift
- Finding a specific tool, cart, or asset means walking the floor and asking people, not checking a screen
- Reports show line-level totals but can’t answer where a specific asset physically is right now
- Discrepancies between the system and the floor only surface after they’ve already cost time — a missing tool, a stalled machine, a delayed shipment
The same pattern shows up in machine utilization reporting. A plant might log a machine as “running” for an entire shift because that’s the status entered at the start of the shift, even though the machine sat idle for forty-five minutes waiting on a part. On paper, utilization looks fine. On the floor, that idle time is real lost capacity that never shows up anywhere until someone notices the shift fell behind. As a result, the plant keeps making decisions — staffing, scheduling, maintenance timing — based on a picture that was already stale by the time anyone looked at it. Unplanned downtime is consistently one of the costliest line items in manufacturing, and checkpoint-based visibility is structurally unable to catch it before it happens — by the time a stalled machine shows up on a spreadsheet, the cost is already locked in.
What Real-Time Shop Floor Data Actually Requires
Closing that gap requires real-time shop floor data: a continuous stream of what’s actually happening, not a series of manual snapshots stitched together after the fact. That means automated, sensor-based capture in place of relying on someone to scan a barcode or update a spreadsheet field.
BLE (Bluetooth Low Energy) tags locate assets to within roughly 3 to 10 feet — accurate enough for most zone- and room-level tracking. RFID (Radio-Frequency Identification), active or passive, handles high-volume check-in and check-out points like tool cribs and shipping docks. UWB (Ultra-Wideband) delivers sub-foot precision where it’s genuinely needed, such as calibration-critical tool tracking. Environmental sensors add temperature, humidity, and vibration context that a barcode scan was never built to capture.
No single one of those technologies covers an entire plant well. A tool crib, a shipping dock, and a cleanroom don’t share the same visibility requirements, and forcing one radio to handle all three usually means over-engineering some areas and under-serving others. Most vendors pick one sensing technology and build a company around it, which means the customer ends up bending their floor to fit the platform instead of the other way around.
The better approach flips that: your environment decides. Assess what each part of the floor actually needs, then deploy the sensing mix that fits it — BLE here, UWB there, RFID at the dock — feeding one data stream instead of three disconnected point solutions that never talk to each other. In practice, that means a manufacturer doesn’t have to choose between accuracy and coverage. Areas that need sub-foot precision get UWB; areas where room-level accuracy is plenty get BLE; high-volume check points get RFID. Same pipeline, same dashboard, no compromise forced by a single-radio platform.
Introducing the Capture Layer
That data stream needs somewhere to land before it’s useful to anyone. That’s the capture layer: the part of the operations stack that turns physical activity into structured data before an MES, ERP (Enterprise Resource Planning), or BI (Business Intelligence) tool ever sees it. It’s also the piece of Physical AI that gets skipped most often. Companies invest in dashboards, AI models, and analytics platforms, and assume the data those tools need already exists. Usually, it doesn’t — or it exists in fragments spread across spreadsheets, barcode logs, and someone’s memory of where they last saw the torque wrench.
Where Thinaer Fits
Thinaer sits at exactly this layer, capturing and structuring operational data — location, movement, environmental conditions, machine utilization — and delivering it to whatever systems a manufacturer already runs. The MES still tracks work orders, the ERP still runs the business, and the BI tool still builds reports — none of that gets replaced. What changes is that all three finally have something they didn’t have before: current, accurate, continuous data about what’s actually happening on the floor. In practice, that data shows up first in Sonar, Thinaer’s operational visibility application — real-time maps, alerts, and time-out tracking that reflect the floor as it is right now, not as it was at the last checkpoint.
This is the first layer in a three-part stack: Capture, Learn, Act (see the full framework here). Capture is the sensors, gateways, and structured data streams — the layer Thinaer owns. Learn is where digital twins, simulations, and AI models turn that data into insight. Act is where autonomous systems and automated workflows do something with it. Skip Capture, and nothing downstream has anything real to work with, no matter how sophisticated the model sitting on top of it is. (For more on why GenAI specifically depends on this layer, see Physical AI Starts on the Floor: Why GenAI Needs a Capture Layer.)
Structured data flows from Capture into Learn and Act. Nothing downstream works without it.
What Changes When Capture Comes First
Before: a plant manager checks a dashboard built on the last barcode scan or shift-change update, and treats it as current. After: the same dashboard reflects the floor as it actually is right now, because the data feeding it comes from continuous sensor capture instead of periodic manual entry.
That shift is already running at scale. Thinaer’s capture layer covers more than 12 million square feet across 33 locations, with 150,000-plus sensors generating over 10 million triggered events in 2025. None of that requires a manufacturer to rip out the MES or ERP they already rely on. It requires giving those systems real data to work with.
What This Means for Your Next Dashboard, Report, or AI Initiative
Every dashboard that shows the wrong picture, every MES that logs a checkpoint instead of a current state, and every AI initiative that stalls out on bad inputs traces back to the same root cause: nothing captured the floor accurately in the first place. That’s true whether the next problem on your list is an MES that can’t keep up with production reality, an AI tool that keeps flagging false anomalies because it’s working from stale data, or an executive report that looks confident and turns out to be wrong. Each of those is really the same capture gap showing up in a different place — and it’s the thread running through the rest of this series.
This is the first post in a four-part look at Physical AI in operations. Up next is a look at why MES systems hit a ceiling without continuous capture underneath them. After that, the series turns to what happens when AI troubleshooting tools are finally fed real-time data instead of stale checkpoints. The last post covers what changes for executive reporting when the numbers reflect the floor as it actually is. Each builds on the same starting point: capture has to come first. (For a closer technical look at how that capture layer actually works, see IT/OT Convergence: How the Capture Layer Actually Works.)
Manufacturing visibility isn’t something you buy as a finished dashboard. It’s something you build, starting with what gets captured on the floor. See what that looks like for your operation in Sonar.